The Heroku’s Ugly Secret blog post went viral last week. I wrote in defense of Heroku, which has now responded with an official Routing Performance Update.
Random request queuing has been discussed in the past in Tim Watson’s post based on a response by Heroku’s Adam Wiggins. While the documentation may not have been accurate or even somewhat misleading, we, at Artsy, understood the strategy and the limitations of the routing mesh for quite sometime. Therefore, we have been making continuous efforts to improve our application’s performance and reduce the negative impact of random routing inside the routing mesh over the past few months.
One thing we didn’t do, was to measure the actual wait time inside a dyno. In restrospect, it seems obvious that we should have. In this post we’ll describe a middleware to do so. This is entirely based on the work of David Yeu, Jason R Clark and RG’s own Andrew Warner.
With this code in place, here’s a 12 hour graph of our website’s API performance. The dyno wait time for our application, in green, averaged 61.1ms for a total of 301ms average per request, which is 1/5th of the total request time. It’s certainly a lot, but we do spend a lot more time in our own code.
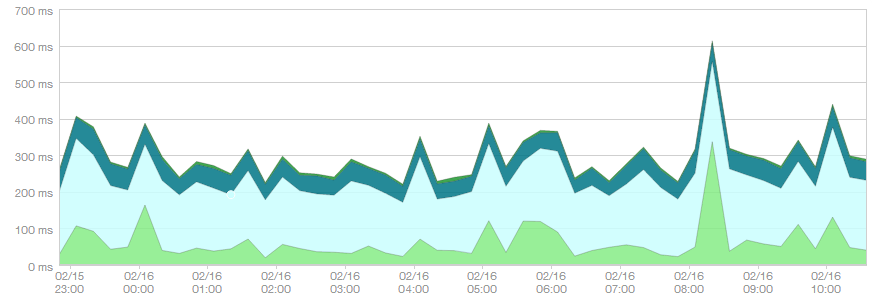
Note that the single peak on the right of the graph corresponds to a dyno auto-scale job. We double the number of dynos with early morning traffic, which causes new dynos to boot up and accumulate requests before they are “warm” enough to process requests at their normal rate.
Queue Logger Middleware
Heroku adds an X-Request-Start header as documented here into every request it routes. We can then subtract the value of this header from Time.now once we’re inside our code. We’re also removing the the X-Heroku-Queue-Wait-Time header, as it’s mostly zero with the current Heroku routing strategy and gets used as queue time by the NewRelic RPM. Finally, we’re setting env['HTTP_X_QUEUE_TIME'], which will be picked up by NewRelic as documented here and adding a X-Queue-Time header to be able to see the queue time in every response with client tools.
```ruby config/queue_time_logger.rb
https://gist.github.com/a-warner/f5db30857ed3423cea79
combination of https://gist.github.com/daveyeu/4960893
and https://gist.github.com/jasonrclark/d82a1ea7695daac0b9ee
class QueueTimeLogger attr_reader :app
def initialize(app, options = {}) @app = app end
def call(env) now = Time.now.to_f
env.delete("HTTP_X_HEROKU_QUEUE_WAIT_TIME")

microseconds = (now * 1_000_000).to_i
env["HTTP_X_MIDDLEWARE_START"] = "t=#{microseconds}"

perf_headers = {}
if (request_start = env["HTTP_X_REQUEST_START"])
  request_start_microseconds = request_start.gsub("t=", "").to_i * 1_000
  queue_time_microseconds = [ microseconds - request_start_microseconds, 0 ].max
  env["HTTP_X_QUEUE_TIME"] = "t=#{queue_time_microseconds}"

  queue_time_milliseconds = (queue_time_microseconds / 1_000).to_i
  perf_headers["X-Queue-Time"] = queue_time_milliseconds.to_s
end

status, headers, body = app.call(env)
[ status, headers.merge(perf_headers), body ]   end end ```
We insert this middleware into Rails. Remember that the middleware is executed in reverse order, so you should put this in the end of your config/environment.rb.
ruby config/environment.rb
require File.expand_path('../queue_time_logger', __FILE__)
config.middleware.use QueueTimeLogger
Time Skew
It’s important to note that since the X-Request-Start header is inserted by the router, we’re not capturing queue wait time, we’re capturing (queue wait time) + (clock skew between the router and the machine servicing the request). The time skew has a non-negligible contribution to the sum, especially that the sign of the clock skew contribution is unknown and we are replacing any negative time difference with 0. We can only hope that Heroku does a reasonable effort at synchronizing clocks between the router and the dyno servers.
What About Dumb Routing?
One of the basic issues with one-request-at-a-time web servers and random routing is how single-threaded web servers accept connections. It sounds technically feasible that the web server could report back to the router that it’s currently processing a request and have the router pick another dyno, but there’re two non-trivial difficulties with implementing this.
The first is that it would require cooperation from the Heroku router, as currently, closing a TCP socket would cause it to return a 503 to the client.
The second is in the way EventMachine accepts requests in a single-threaded scenario: a request will block the EventMachine reactor, and only once it has unblocked the reactor, will it accept more requests. Those requests will sit in the TCP queue for the duration of the long request, defeating the whole concept.
Improving Throughput on Heroku
It’s important to understand that with every system you will get increasingly unfair scheduling at the load balancer when you have more than your serviceable load. To improve this on Heroku you have to either reduce the time to service each request or provision more dynos. All things considered, I think that being able to service long-running requests without any significant impact on the entire distributed system would be a luxury.
Links
- Queue Logger Middleware
- Heroku’s Ugly Secret
- In Defense of Heroku
- Heroku Routing Performance Update
- Heroku No Longer Using a Global Request Queue
- How EventMachine Accepts Connections
- Heroku HTTP Routing Documentation
- NewRelic Agent Instrumentation Queue Time Implementation
- Tracking Front-End Time with NewRelic
Comments