Knowing how well your API performs in real time is essential to any successful project. That’s because you can’t fix what you can’t measure.
We use and heavily contribute to Grape, a Ruby API DSL. Grape is a Rack middleware and we have been reporting API performance data to NewRelic with code from my older blog post.
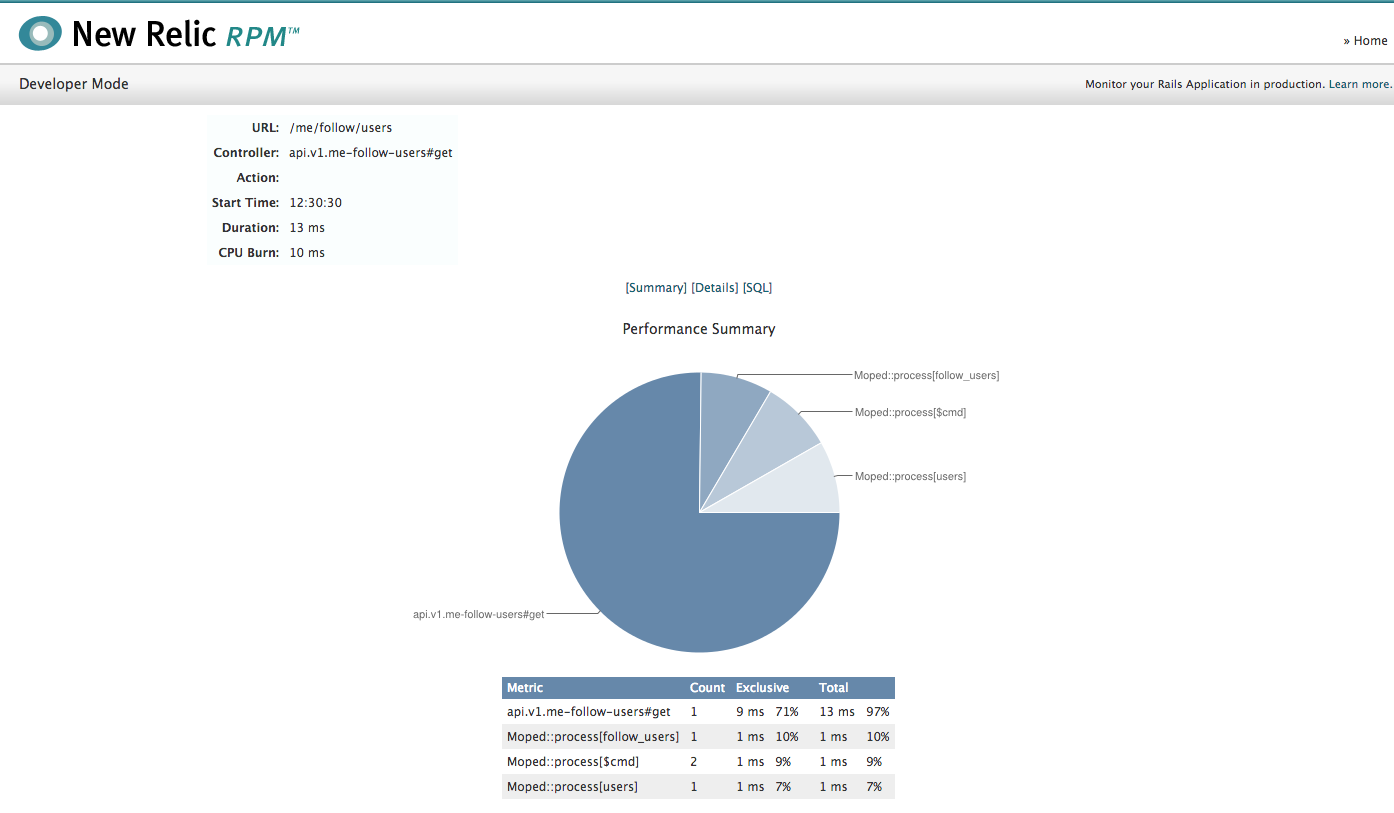
It’s time to improve the reporting implementation and address performance monitoring in both development and production environments. Here’s what a single API request breakdown is going to look like.
![]()
NewRelic RPM
The first step is to add the newrelic_rpm gem to Gemfile, which implements the actual realtime performance reporting to NewRelic. We also use Mongoid and the Moped MongoDB Ruby driver, which can be instrumented with newrelic_moped.
``` ruby Gemfile gem “newrelic_moped”, “0.0.3” gem “newrelic_rpm”, “3.3.3”
You will need `config/newrelic.yml` in your application. Ours can be found in [this gist](https://gist.github.com/4170458) and works well both locally and on Heroku.

Instrumenting Grape
-------------------

In the past we used [NewRelic::Agent::Instrumentation::API](https://gist.github.com/1233422), which works for any generic Rack middleware. This would report all API calls to NewRelic, but would treat requests to */api/artist/andy-warhol* and */api/artist/wassily-kandinsky* as unrelated. That is because the instrumenter is a Rack middleware that wraps Grape requests *before* they reach Grape. The only information available is the request URL, and not the actual API route that is going to be matched when the request is processed.

We want both requests to */api/artist/andy-warhol* and */api/artist/wassily-kandinsky* to be treated as */api/artist/:id*. Lets insert a middleware inside Grape itself, once the URL has been matched to a route.

``` ruby api.rb
class API << Grape::API
  use ApiNewRelicInstrumenter
  ...
end
The new instrumenter has access to the current API endpoint via env['api.endpoint'] and reports data via NewRelic’s ControllerInstrumentation.
class ApiNewRelicInstrumenter < Grape::Middleware::Base
  include NewRelic::Agent::Instrumentation::ControllerInstrumentation

  def call(env)
    trace_options = {
      category: :rack,
      path: env['api.endpoint'].routes.first.route_path,
      request: request,
      ...
    }

    perform_action_with_newrelic_trace(trace_options) do
      yield
    end

  end
end
The complete code for ApiNewRelicInstrumenter can be found in this gist. It supports enabling and disabling performance reporting by setting NEW_RELIC_ID and works around NewRelic’s method name limitations (these cannot contain slashes).
Development Environment
You can now see NewRelic performance data in development mode, too. If you mount Grape inside Rails run NEW_RELIC_ID=foo rails s. Navigate to http://localhost:3000/newrelic to see your local traces.
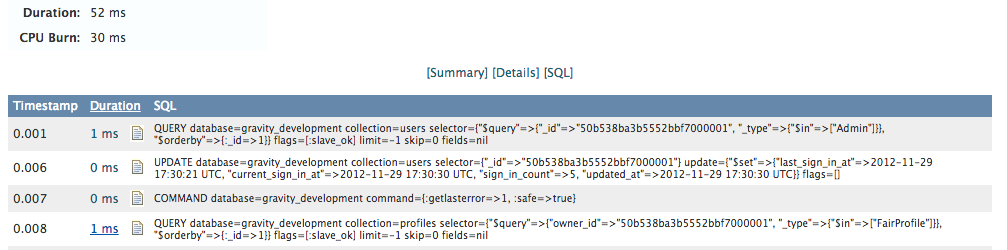
Drill into an individual request to find several detailed breakdowns of how time was spent, including specific MongoDB queries (under “SQL”, naturally).
NewRelic is a commercial product, but you can run development mode for free! Note that enabling this will triple your local Rails boot time: we enable development mode by setting development_mode: <%= !!ENV['NEW_RELIC_ID'] %> in newrelic.rpm.
Comments