We have a lot of really awesome data. Things worth exploring, and visualizing. We have an entire team devoted to it, looks like they’re hiring too. Not all of the output of the data comes from that team though, 2 years ago our Director of Product Engineering, Craig Spaeth created a static-site generator that mapped our partners around the globe. Last week I’ve been improving it.

Projects like these happen in most companies, quick hacks for one offs that are opened 2 years later by someone completely different to build on top of it. In trying to follow the Boy Scout rule, I’ve cleaned it up and consolidated some other similar projects. This post is a rough road-map of what making this PR looked like.
The aim was to visualise data we had created on when galleries were founded. Then to be able to see how that corresponds with our artwork inquiry data.
Coming back to an npm app 2 years later
Straight off the bat, nothing worked :D
This isn’t too surprising, I’m pretty sure we’d have the same problem with an iOS project too. This was mainly due to dependencies switching between major versions due to zero locking on any of the versions.
{
  ...
  "dependencies": {
    "async": "*",
    "browserify": "*",
    "coffee-script": "*",
    "coffeeify": "*",
    "d3": "*",
    "datamaps": "git://github.com/markmarkoh/datamaps.git",
    "mongojs": "*",
    "topojson": "*",
    "watchify": "*"
  }
}
Switching to Yarn fixed this by introducing a lock file, this means that the next time someone else comes along they’ll get the exact same setup that I’ve been working against.
CoffeeScript
I have zero experience with CoffeeScript. My high-level JavaScript experience only comes from the last 6 months, and it’s a different world at the minute. Two years ago CoffeeScript was in it’s prime, as the first of the JavaScript transpilers - if this is new to you, I’d strongly recommend watching this talk:
We have a lot of CoffeeScript in production, here’s a few key parts of Artsy’s infrastructure:
- artsy/force - our website
- artsy/microgravity - our mobile website
- artsy/positron - our editorial staff’s CMS
..and there’s more. Thus having an understanding of it is pretty essential to writing code across all of Artsy’s businesses. The TLDR for CoffeeScript is that it applies a lot of the elegance in Ruby to JavaScript. You should feel comfortable with JavaScript before using it, as it requires understanding what the language facade is doing.
A lot of the best ideas from CoffeeScript have been migrated into modern JavaScript. My favourite is ease in how functions can be created:
random = (min, max) -> Math.round(Math.random() * (max - min) + min)
It also supports my favourite part of Ruby’s handling of code-flow using single-line reverse ifs:
pgClient.connect (err) ->
  console.error(err) if err
Which gets to the crux of CoffeeScript’s ideology, I would often start with writing it in JavaScript in my head, then slowly remove syntax. When I got stuck I visited js.coffee to see how something I know what I want to write would look.
Databases
You want to convert all data your companies data into something useful? You better get that data available locally or you’re going to spend a long time iterating. As a side-effect of Artsy converting to microservices I needed three separate databases to connect all the data I needed. It covers over two types of databases: MongoDB and Postgres.
MongoDB
MongoDB is a NoSQL document store database, this means it has no formal data-structure. It feels very JavaScript-y because of this. I host it inside an app, and I use RoboMongo to inspect it.
</div></div>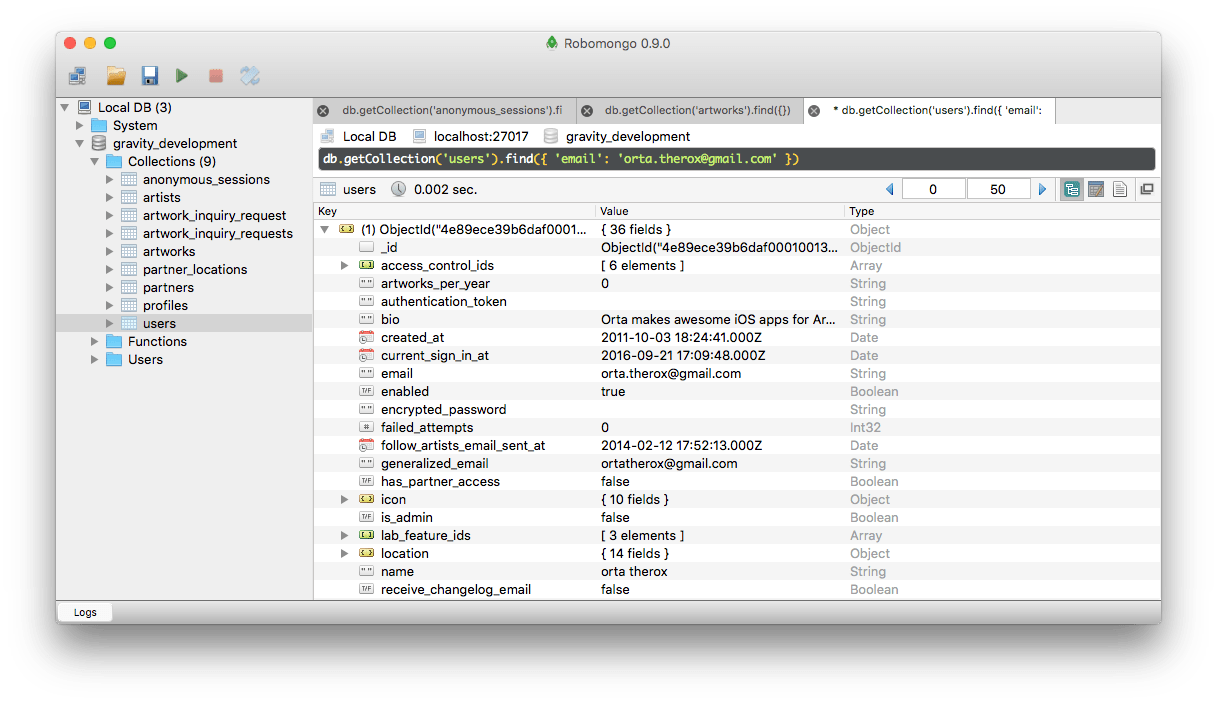 <div class='meta-container'><header> </header></div><div class='date-container'> </div><div class='content-container'><div class='entry-content'>
This works out nicely, I needed to make a local copy of the databases, so I used the answers from this stack overflow
# You'll need to figure out how to connect to your database
mongoexport -d gravity_staging -c artworks -o artworks_collection.json

# Then into merge it into your development machine
mongoimport -d gravity_development -c artworks --file artworks_collection.json
Doing this for the specific collections you’re interested in will help get you set up.
Postgres
Other databases I needed access to were Postgres databases, I don’t know much about databases but Postgres seems to be Heroku’s favourite database so I’ll take that endorsement as gold. It’s an SQL database, which you can do amazing things with. I host it inside an app and use Postico to inspect it.
</div></div>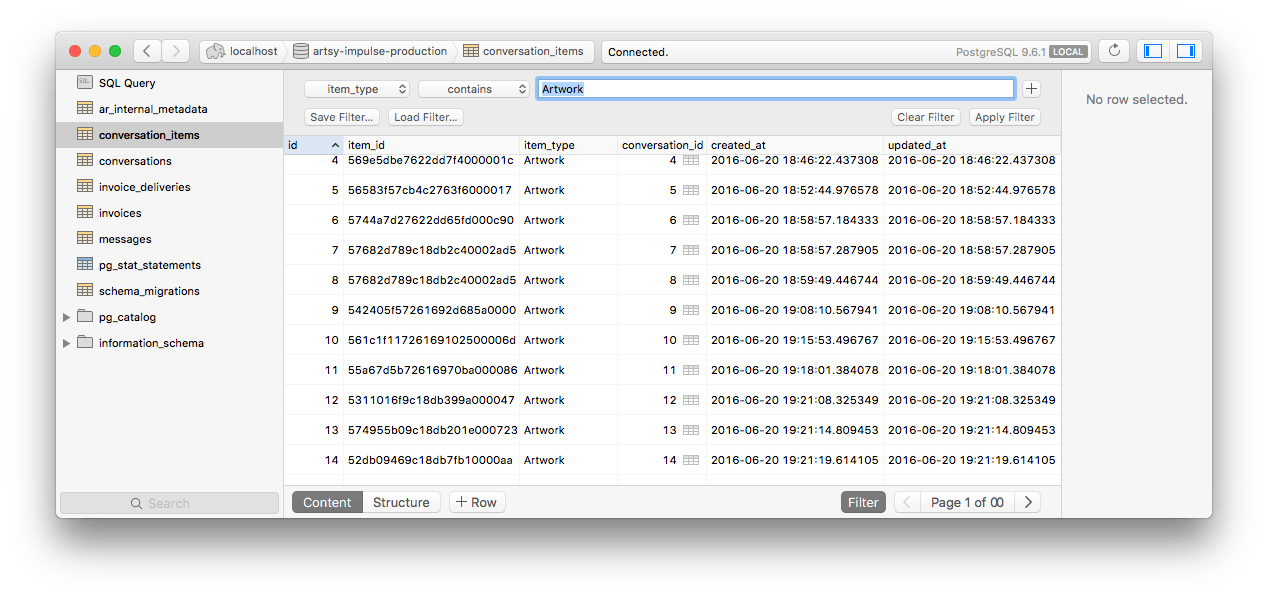 <div class='meta-container'><header> </header></div><div class='date-container'> </div><div class='content-container'><div class='entry-content'>
I grabbed a backup of our databases, they come down as a pg_dump file file which you can replicate locally in your postgres using a command like:
pg_restore --verbose --clean --no-acl --no-owner -h localhost -U [your_name] -d [db_name] [filepath]
Database as CSV
This almost gave me all the data necessary to start work. The other part is a good chunk of new data we wanted mapping was not in a database, it was in a collection of spreadsheet files and occasionally hosted on google docs. Meaning it’s time to reach for a good parser. Whenever this happens I reach for Ruby, which ships with a great CSV parser/writer. I also open the CSV inside Numbers from Apple, which does a great job of providing visibility ( and letting you make quick changes.)
I have a bunch of scripts like this, one which generate more CSV files - I’m keeping the filenames intact to give you a real sense of how much of a quick hack these are:
# Create a new CSV file
CSV.open("/Users/orta/Downloads/end-result.csv", "wb") do |csv|
  # Loop through both derived tables
  tables = ["Partners-Table 1.csv", "Non-Partners-Table 1.csv"]
  tables.each do |t|
    CSV.foreach("/Users/orta/Documents/Gallery\ Date\ Research/" + t) do |row|
      next unless row[0] # bad data
      next unless row[1] # no dates

      # don't trust the CSV
      query = Regexp.new(row[0], Regexp::IGNORECASE)
      partner = Partner.where(given_name: query).first
      partner ||= Partner.where(display_name: query).first

      start_date = row[1]

      # did we find a partner & a location?
      if partner and partner.location_coordinates and partner.location_coordinates.first
        loc = partner.location_coordinates.first
        csv << [partner.name, start_date, loc[:lat], loc[:lon]]
      else
        csv << [row[0], start_date, nil, nil]
        # look up org in burden inside postgres
        # go from org -> lat, long via location's organization_id
      end
    end
  end
end
Once this was ready I created a new script to pull things from another databasea, in theory this code could have gone inside the previous script, but it felt like a good time to get up and make a tea during a pairing session.
require 'CSV'
conn = PG.connect(host: "localhost", dbname: 'burden')

# Write to another end-results
CSV.open("/Users/orta/Downloads/end-result-2.csv", "wb") do |csv|
  CSV.foreach("/Users/orta/Downloads/end-result.csv") do |row|
    # gravity lookups passed, don't need to do anything
    if row && row[2]
      # put in the normal row
      csv << row
      next
    end

    # Galleries  have ' in their names, breaking SQL
    name = row[0].gsub(/'/, "\\'")
    result = conn.exec( "SELECT latitude, longitude FROM locations WHERE organization_id in (SELECT id FROM organizations WHERE name = '#{name}') " )

    # If we've found something, set it
    if result.cmd_tuples > 0 and result[0]
      row[2] = result[0]["latitude"]
      row[3] = result[0]["longitude"]
    end
    result.clear

    csv << row
  end
end
Then finally with a fully fleshed out CSV, I could convert that into something that’s useful for this project, JSON:
require 'CSV'
require 'JSON'

data = []
CSV.foreach("/Users/orta/Downloads/end-result-2.csv") do |row|
  created_at = row[1]
  if row[1] && created_at.strip.length > 0 && row[2] and row[3]
    data << { name: row[0], radius: 4, created_at: created_at.to_i, latitude: row[2].to_f, longitude: row[3].to_f }
  end
end

File.open("/Users/orta/dev/js/sites/partner-map/data/jsons/galleries-subset.json","w") { |f| f.write( data.sort_by { |h| h[:created_at] }.to_json) }
And that gives me the raw data that I can now use with our mapping system.
D3 + Datamaps
There are concepts that you can just pick up, because they are simple evolutions of something you know. D3 is not one of these. D3 is a system for making data-based graphical documents. Learning how to do D3 properly takes time and a perspective change. Luckily we had a Lunch & Learn 2 weeks ago on D3 and now I am a total domain expert.
I jest. However, the talk was definitely enough to do the majority of what I wanted to do. Which was take some static data, and animate it over time. In these cases I get out the trusty setTimeout API call in JavaScript which gets the ball rolling.
I had a few thousand datapoints with a date_created attribute, so it was pretty simple to pull that out and group them according to a time interval. I wanted the freedom to decide how long each animation should last, there probably is a D3 API for this kind of thing but I never spent the time researching. Maybe the next developer can do that.
We use the amazing library Datamaps to show the globe and handle a lot of the lat/long -> pixel mathematics. It is built in a D3 mindset, so with each interval of the animation, I added all of the locations or arcs to it and D3/Datamaps will derive the difference between what it has and what is new and animate those. This makes thinking about the animation simple.
Too much data
One problem I kept hitting against was that we were working with a dataset that couldn’t fit into memory. Initially a direct port of our algorithm to get all of Artsy’s partners and locations would crash node due to memory pressure. Originally we were working with a much smaller data-set, now it’s multiple orders of magnitude bigger. These were pretty easy to fix with a bit of understanding about all the asynchronous callbacks and by finding the async.eachOfLimit function.
Another issue with the amount of data came through trying to visualise them. It would bring down my computer, in the end after trying a few ideas (looking for averages, grouping similar data-points) I found the simplest option to be the one worth shipping. rand(x, y).
#
# Take a set of arcs, and pick a random 1 in x
# yarn run coffee -- data/inquiries/inquiry-random-subsets.coffee
#

fs = require 'fs'

# Random number between min, max
random = (min, max) -> Math.round(Math.random() * (max - min) + min)

# Take an array or arcs, and reduce it to one in amount, then save to path
derive = (amount, arcs, path) ->
  luckyOnes = arcs.filter (arc) -> random(0, amount) == 23
  console.log "There are #{luckyOnes.length} arcs from #{arcs.length} in #{path}"
  fs.writeFileSync __dirname + '/' + path, JSON.stringify luckyOnes

all_arcs = require '../jsons/every-inquiry-arcs.json'
derive(1500, all_arcs, "../jsons/all-inquiries-random-subset.json")
This ended up creating a pretty useful representation of the whole data-set, in a way that is actually renderable without killing the browser’s process.
Code Cleanup + Docs
I spent most of my time inside artsy/partner-map but we had another repo with very similar code, partner/inquiry-map. So I took the time to merge the two of them, officially deprecating inquiry-map. Now those maps can be generated by partner-map, and there’s space for more expansion.
Other than that, I took the time to improve the repo and to do this write-up, so that the next person who comes along can have an idea of some of the scripts and how they all fit together.
Going solo
For a project like this, I did no code review, no testing or other staples of engineering culture at Artsy. This is fine for a project of this scope and pace.
However, I think it’s always worth throwing in an extra 2-3 hours at the end of a hack project to write up some of the tricky parts and cleaning up the codebase for the next person. If you don’t write some tests, then writing some docs or do a quick video.